
Station 01
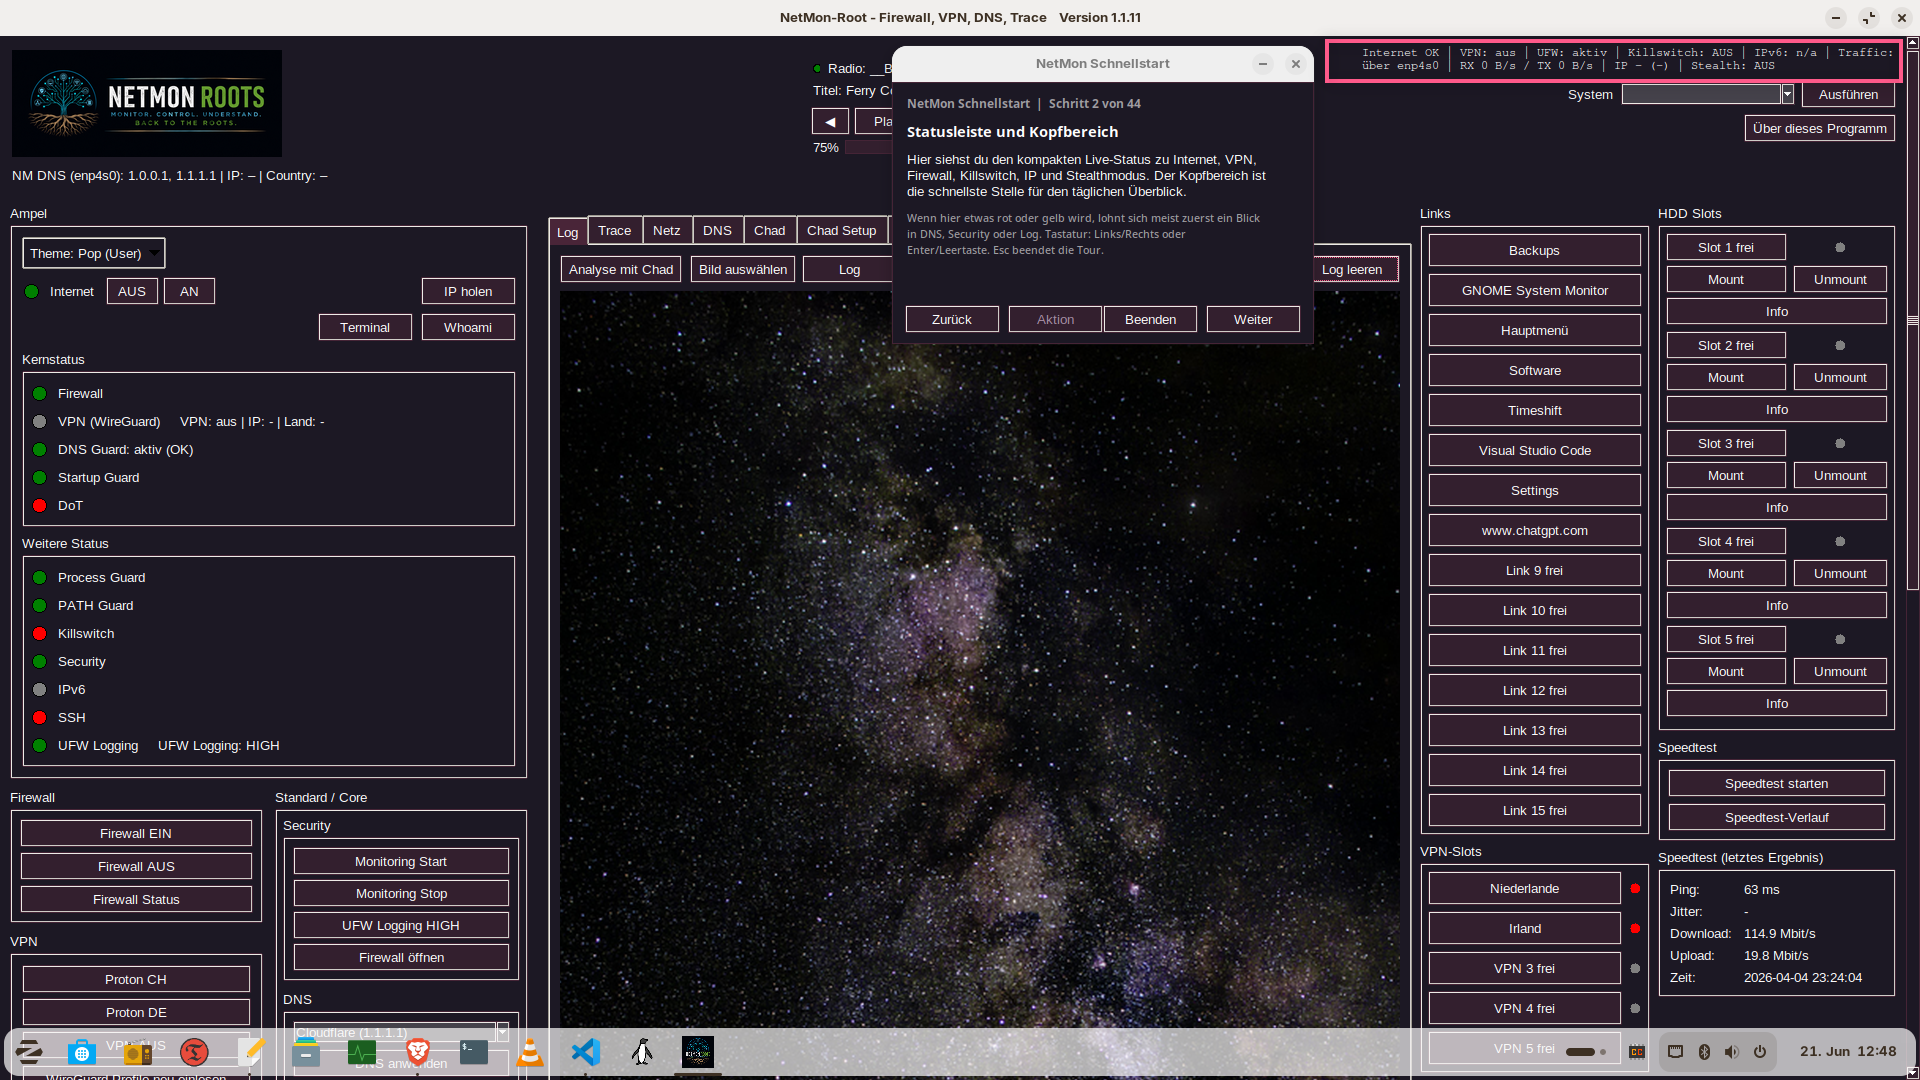
Status line and header area
This view shows the compact daily overview: internet state, VPN, firewall, killswitch, IPv6, traffic, and direct tour entry.
Tour
This page walks through the main product stations. Screenshots and short explanations are grouped here so users can understand both the interface and the built-in tour flow.
Tour stations
This view shows the compact daily overview: internet state, VPN, firewall, killswitch, IPv6, traffic, and direct tour entry.
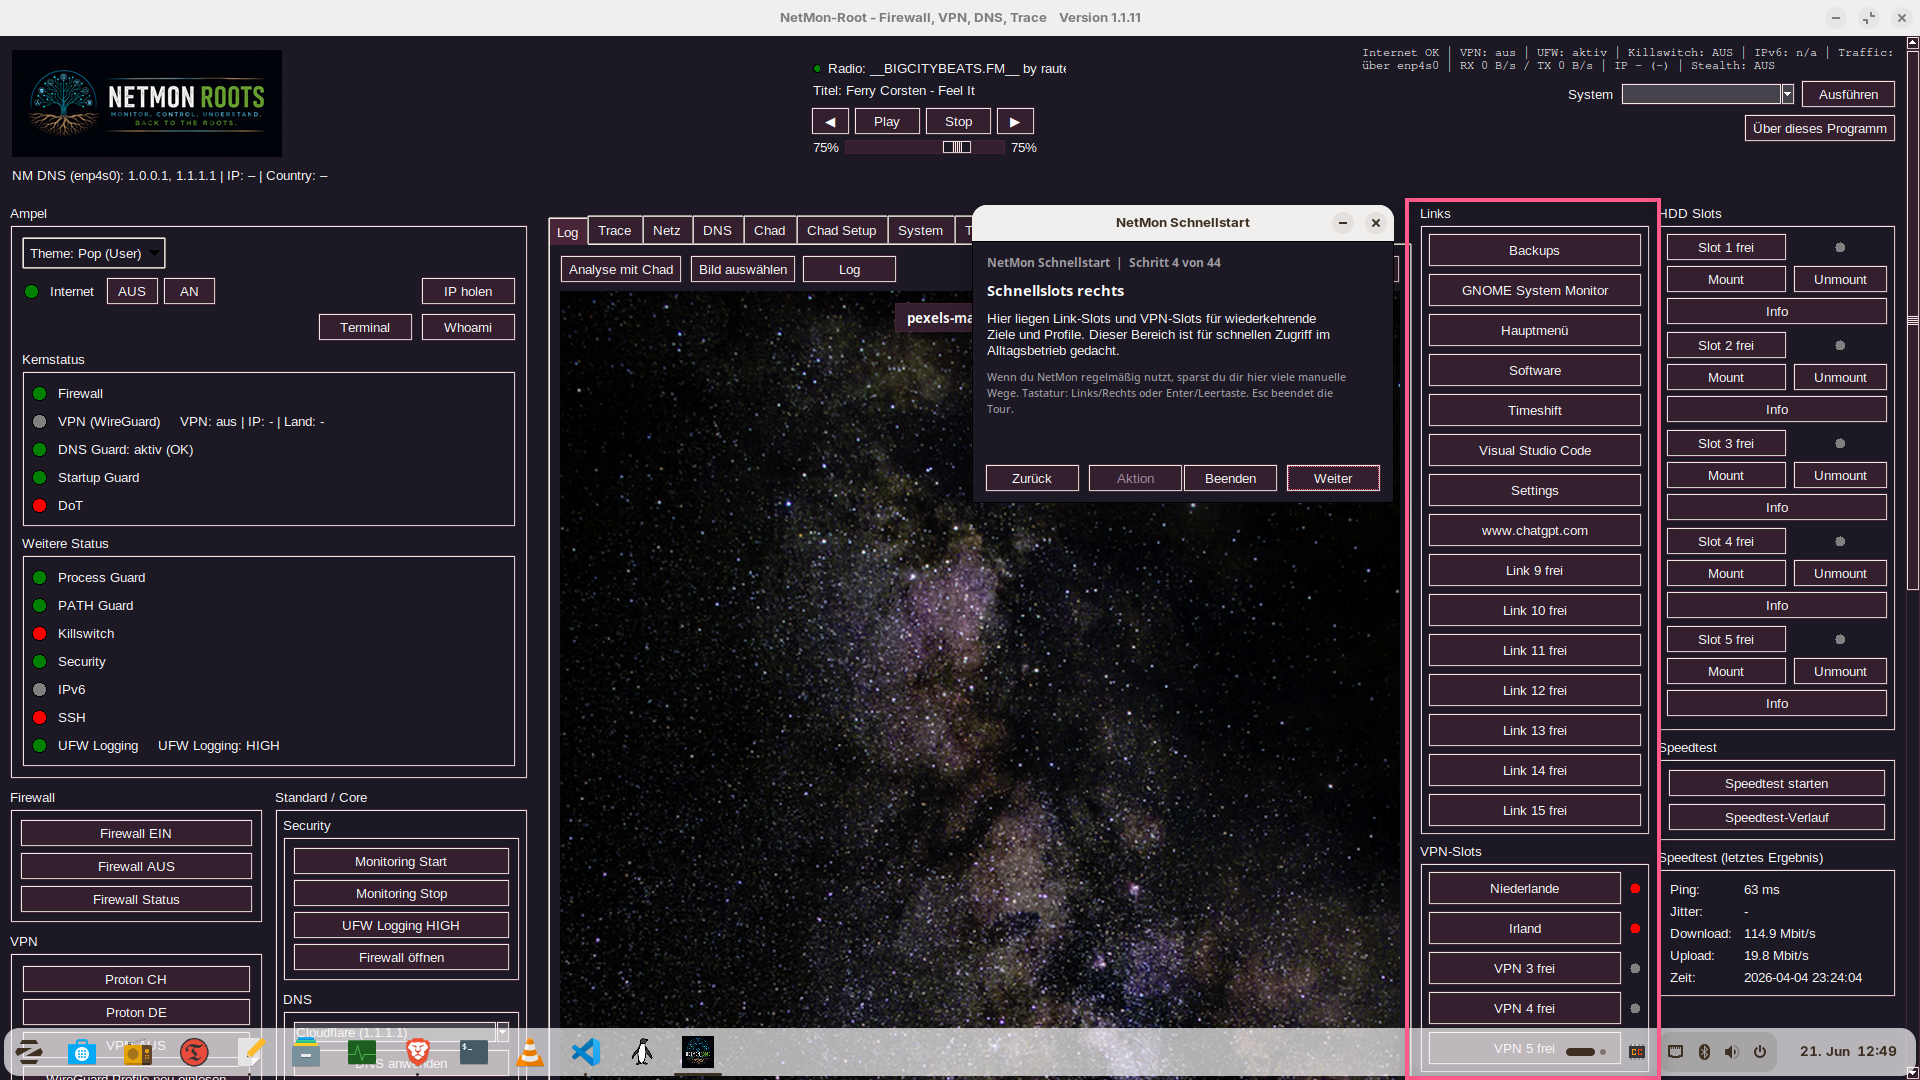
This station shows the right-side quick access area with reusable link slots, VPN slots, and other direct actions for recurring workflows.
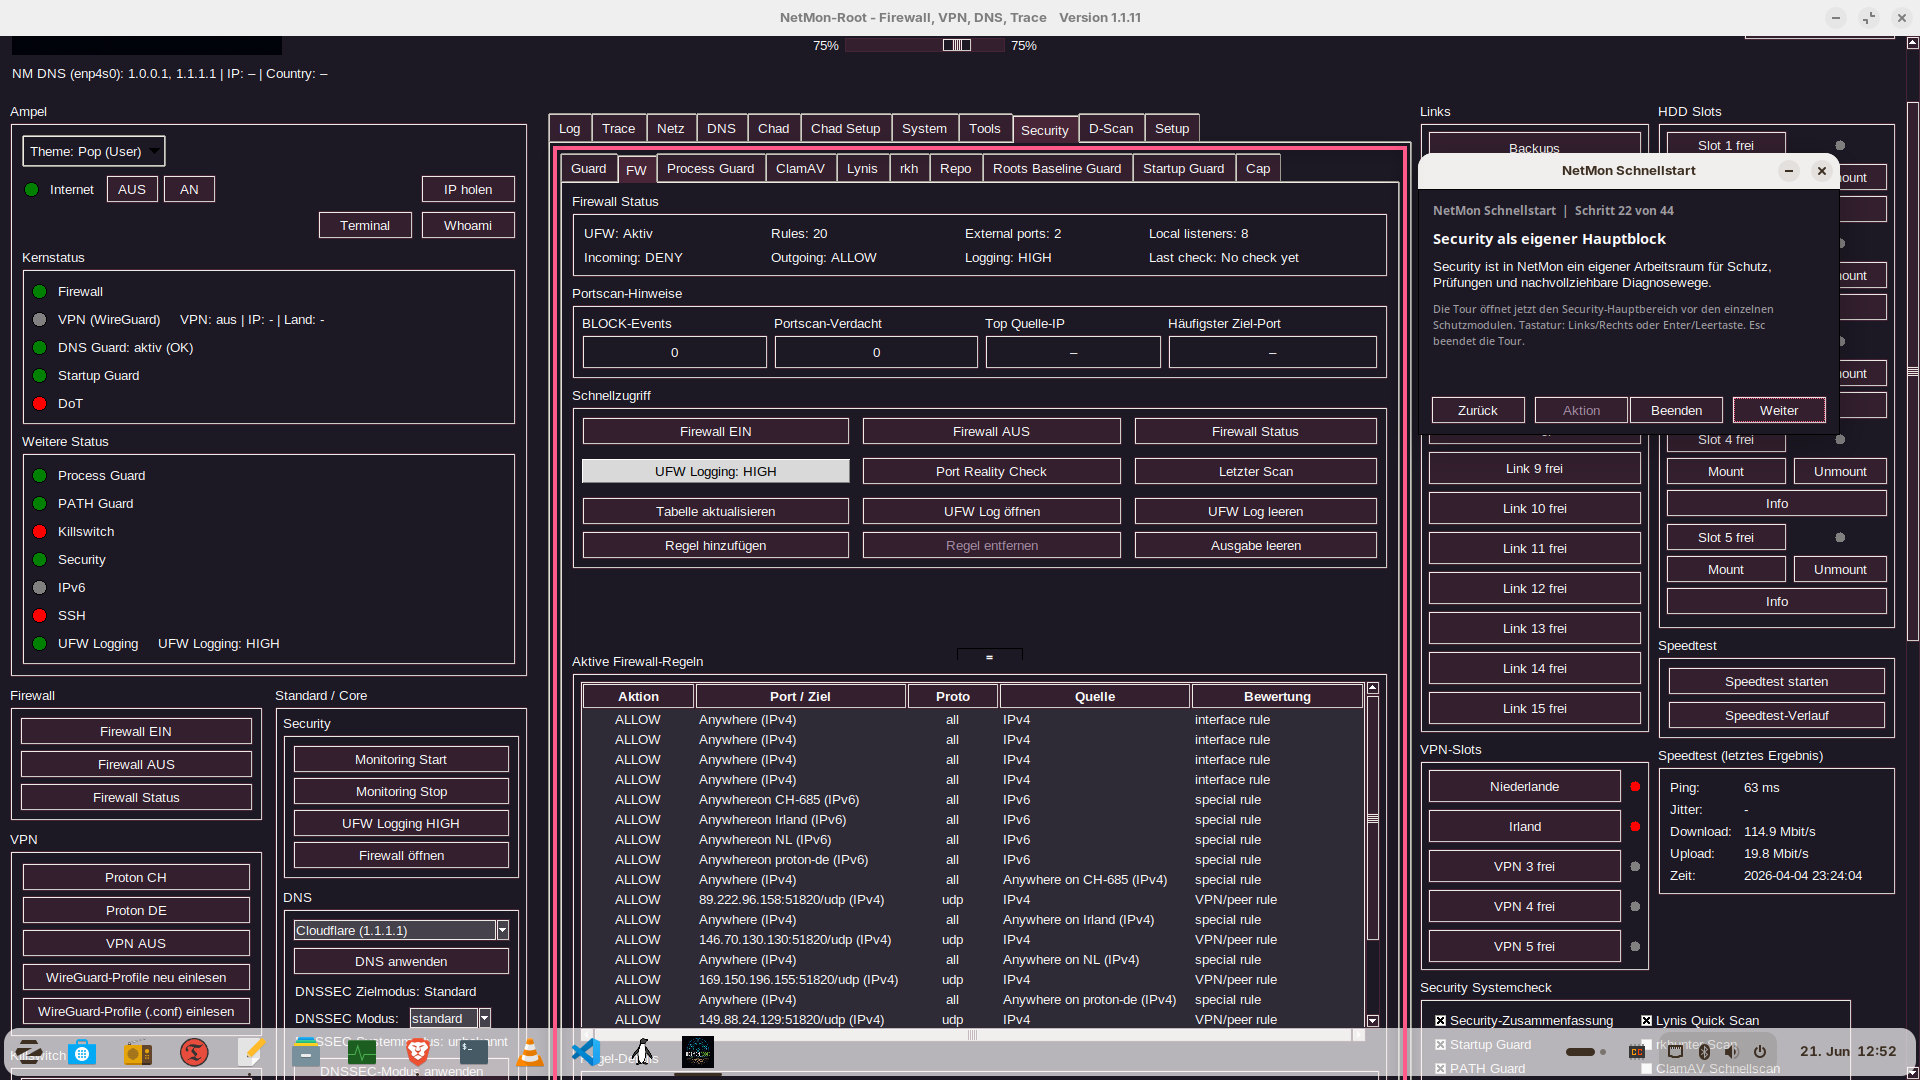
The security area acts as its own workspace with firewall status, portscan hints, UFW actions, and the jump into deeper protection modules.
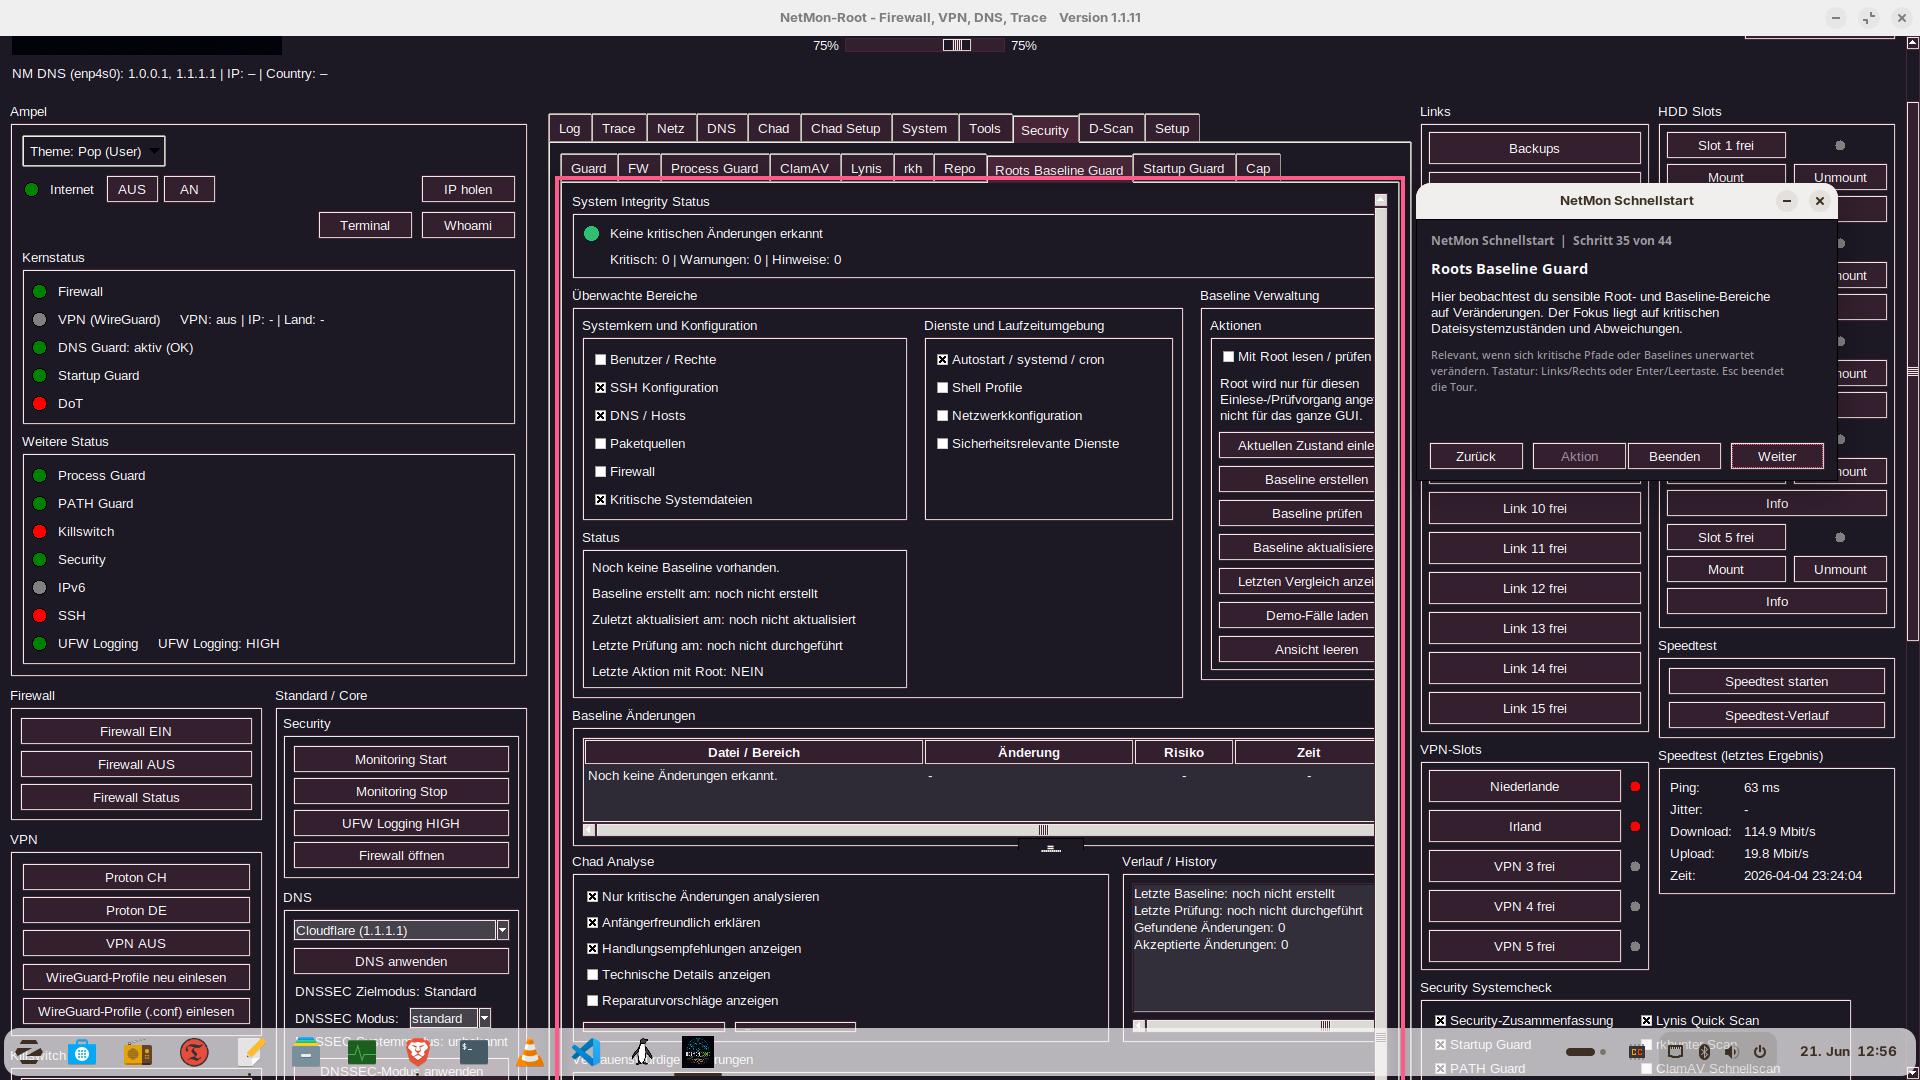
This station highlights structural integrity checks: monitored core areas, baseline management, and change history for sensitive system paths.
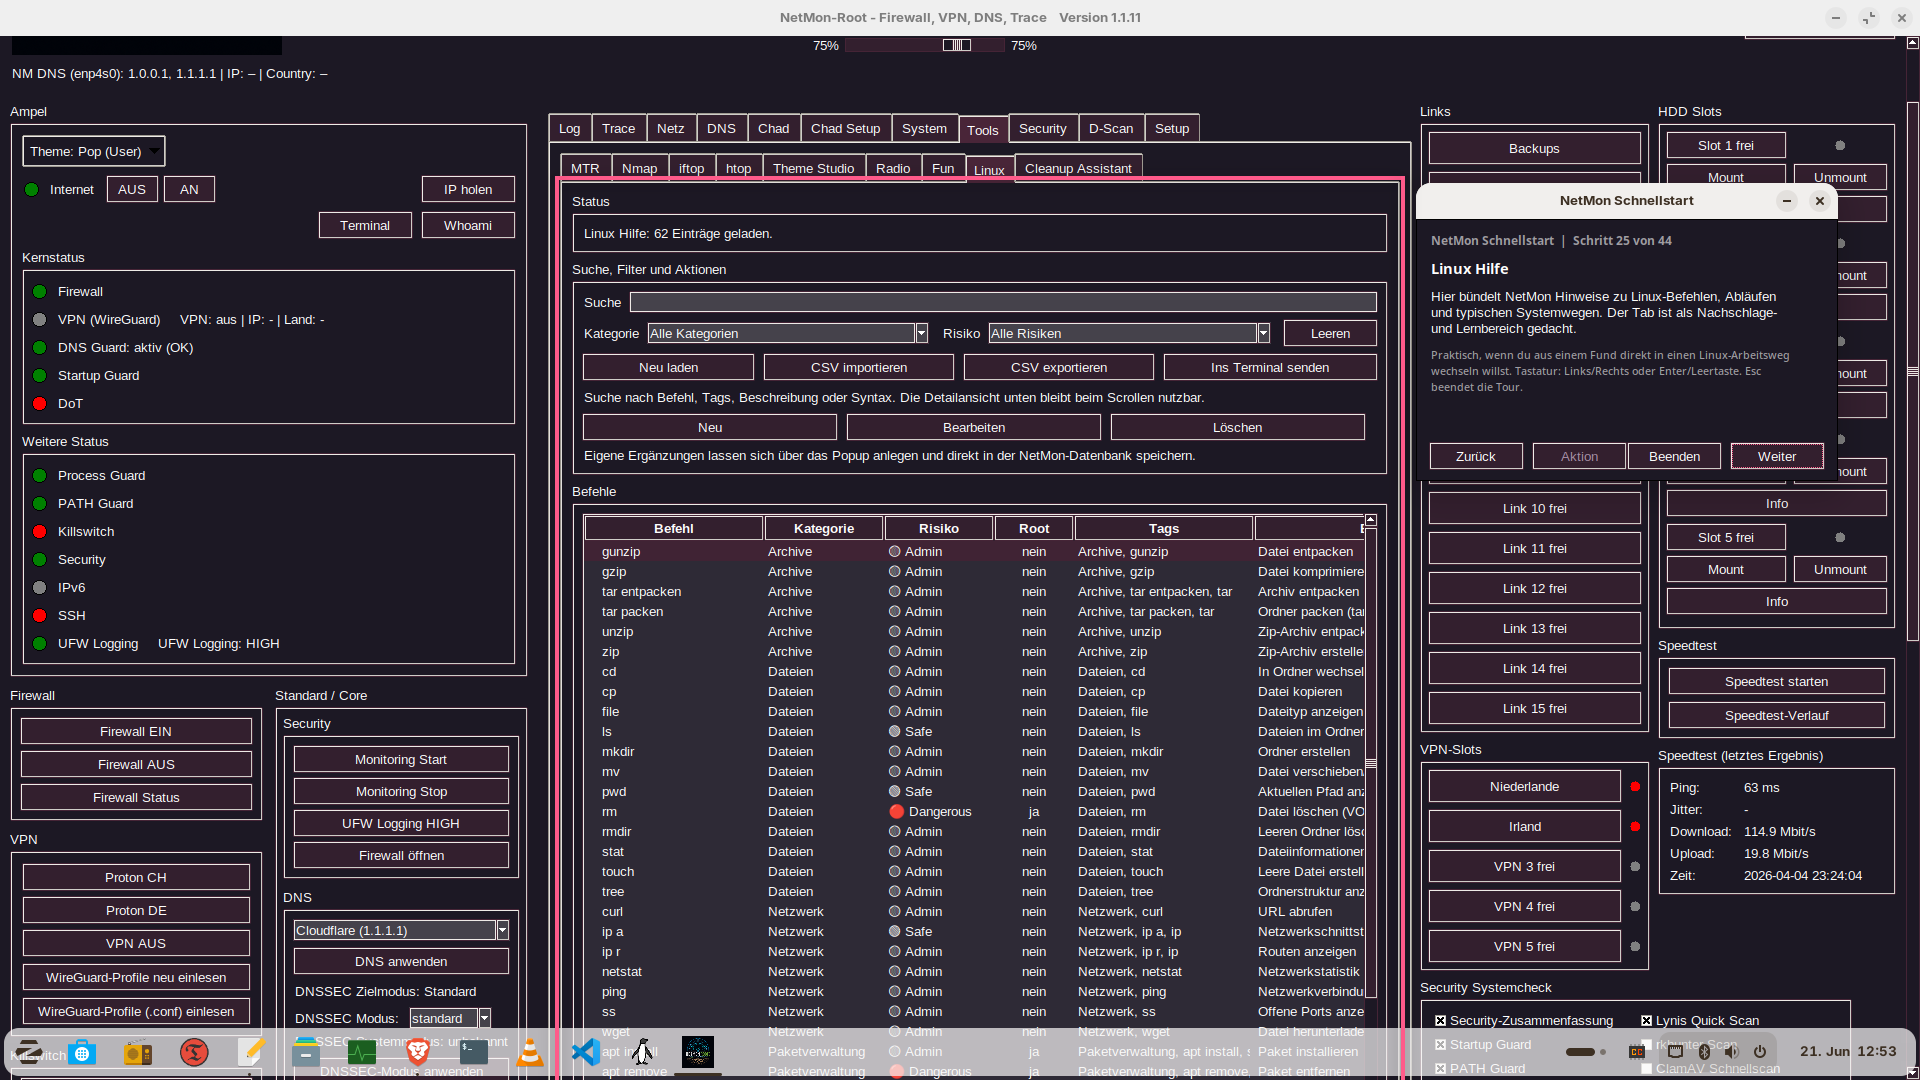
The help tab acts as a built-in reference layer with search, categories, risk filters, PDF prompt copying, and a library for imported Linux help PDFs.
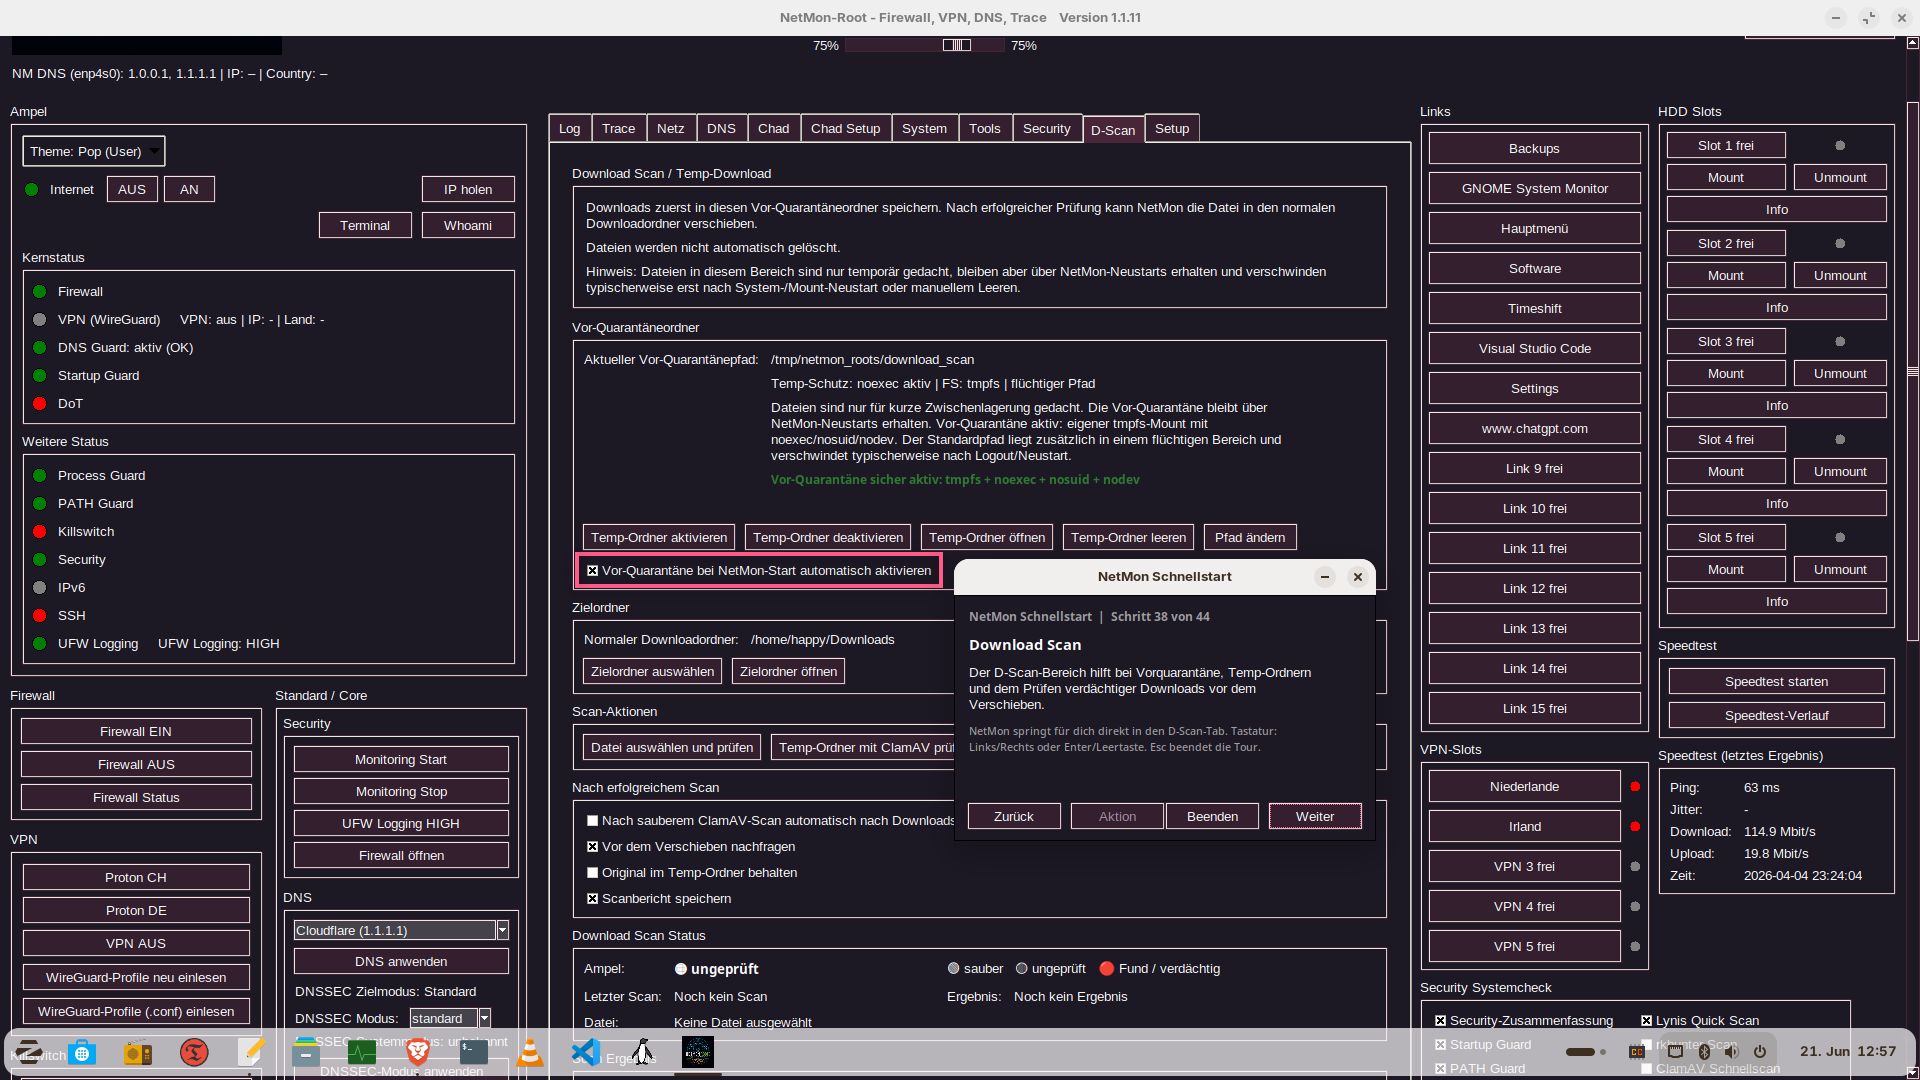
This step shows the download safety path: temporary folders, pre-quarantine, scan actions, and controlled handoff after successful validation.
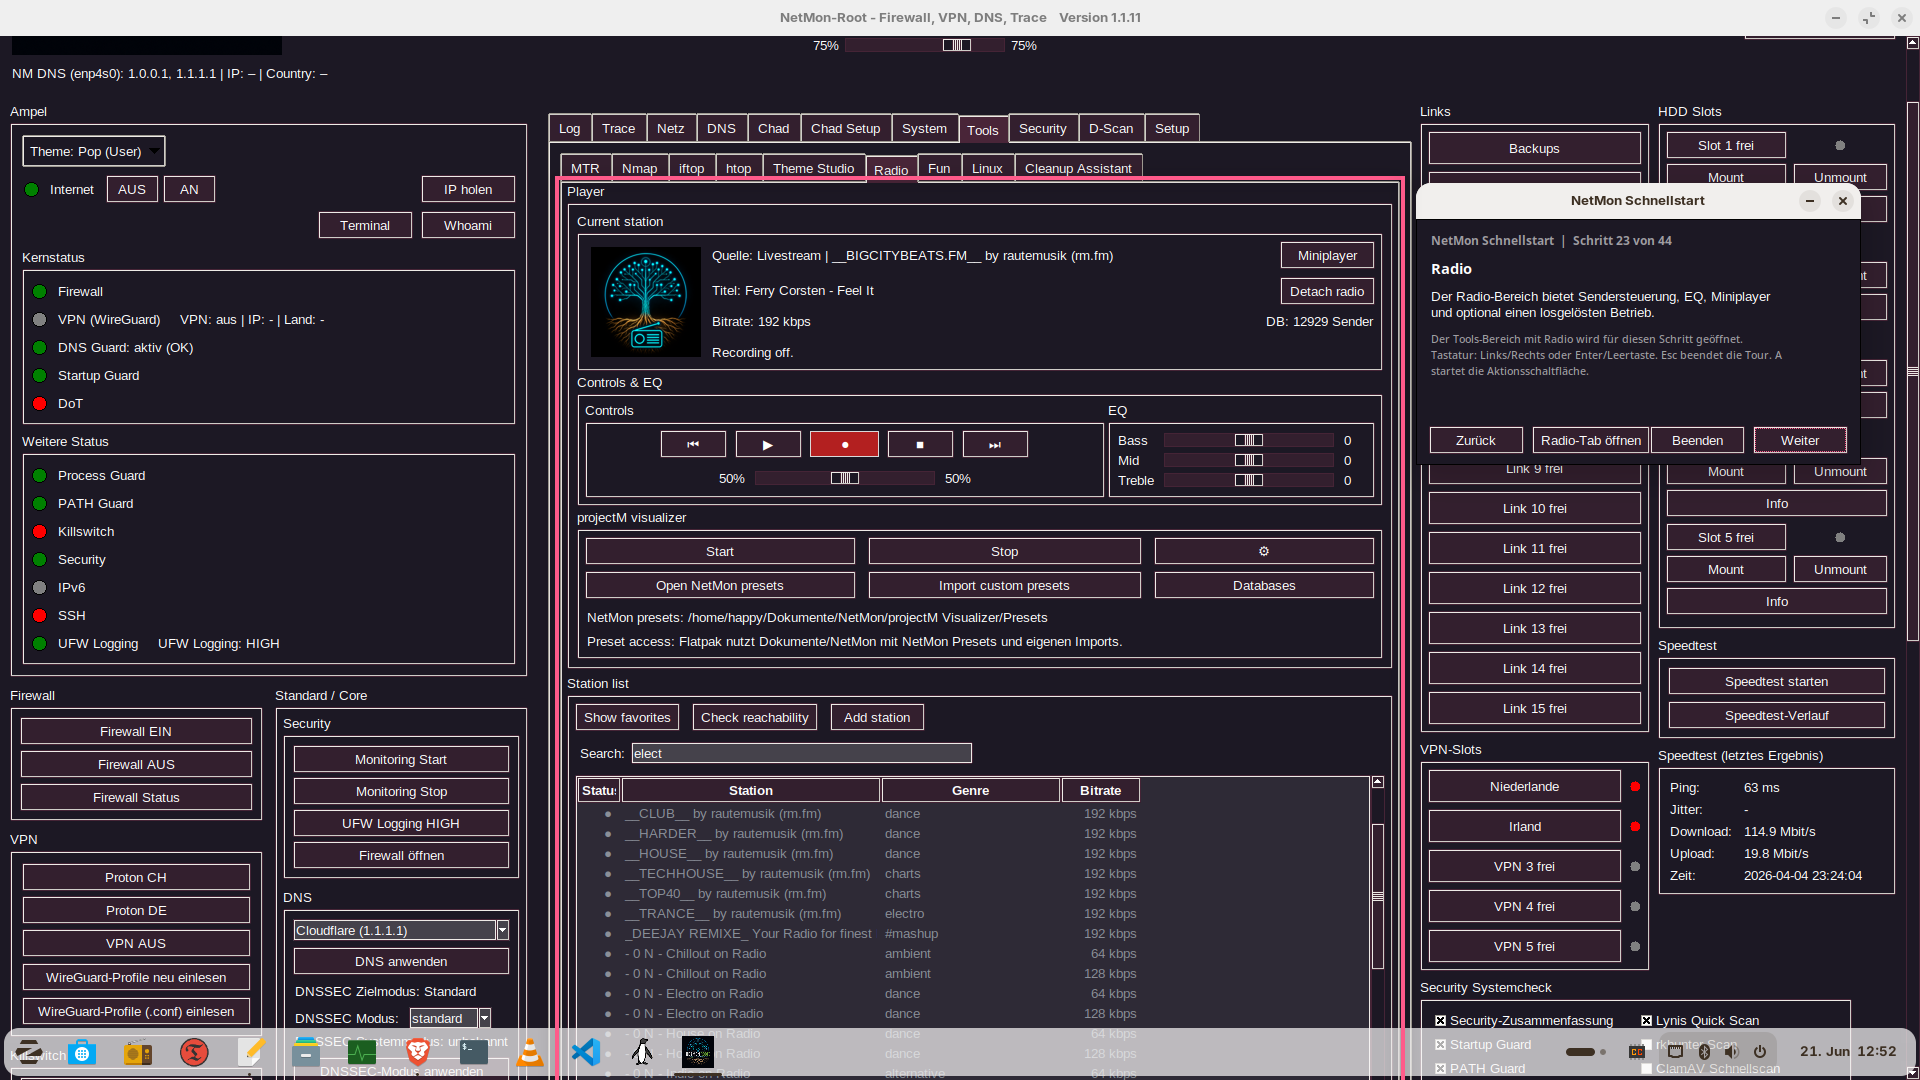
The radio area covers station control, EQ, recording, miniplayer, detach mode, and projectM-based visuals as the lighter side of NetMon.
More views
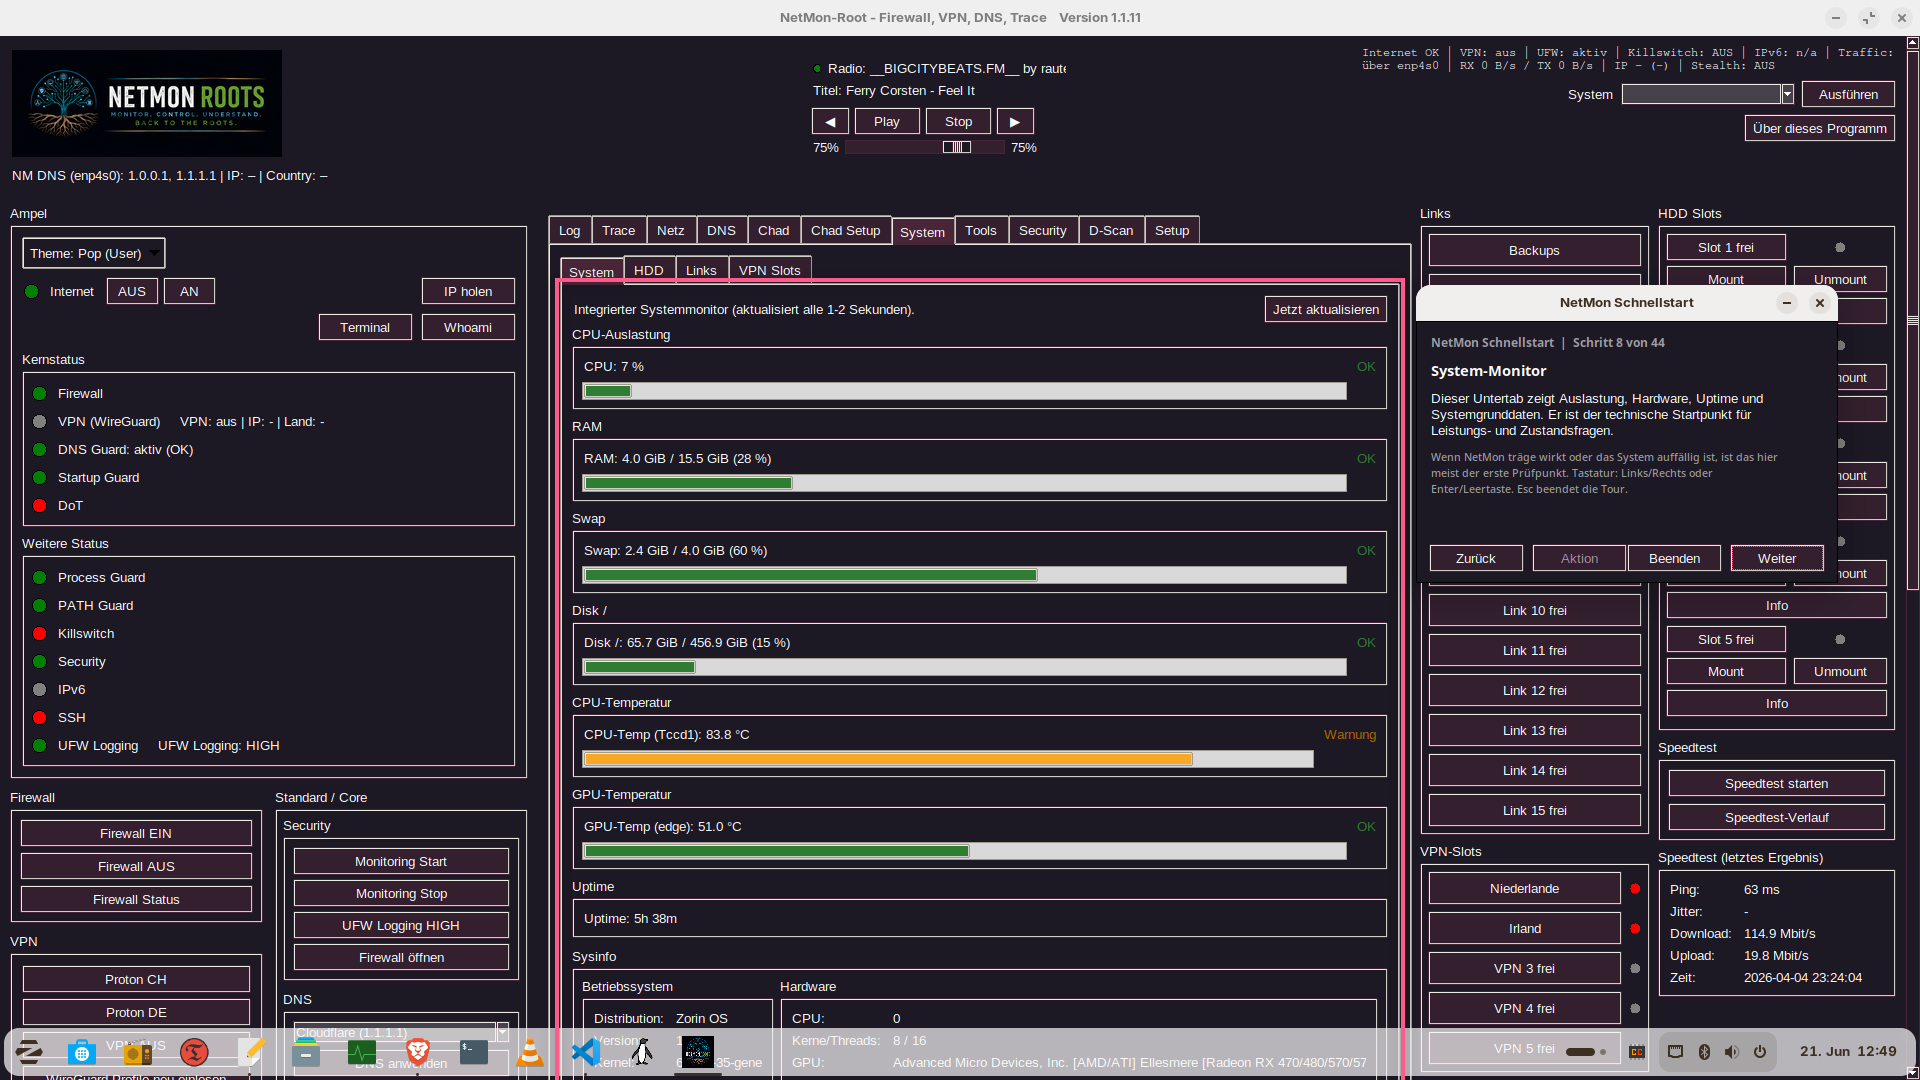
CPU, RAM, swap, uptime, and temperature data are presented directly inside the application as a technical starting point.
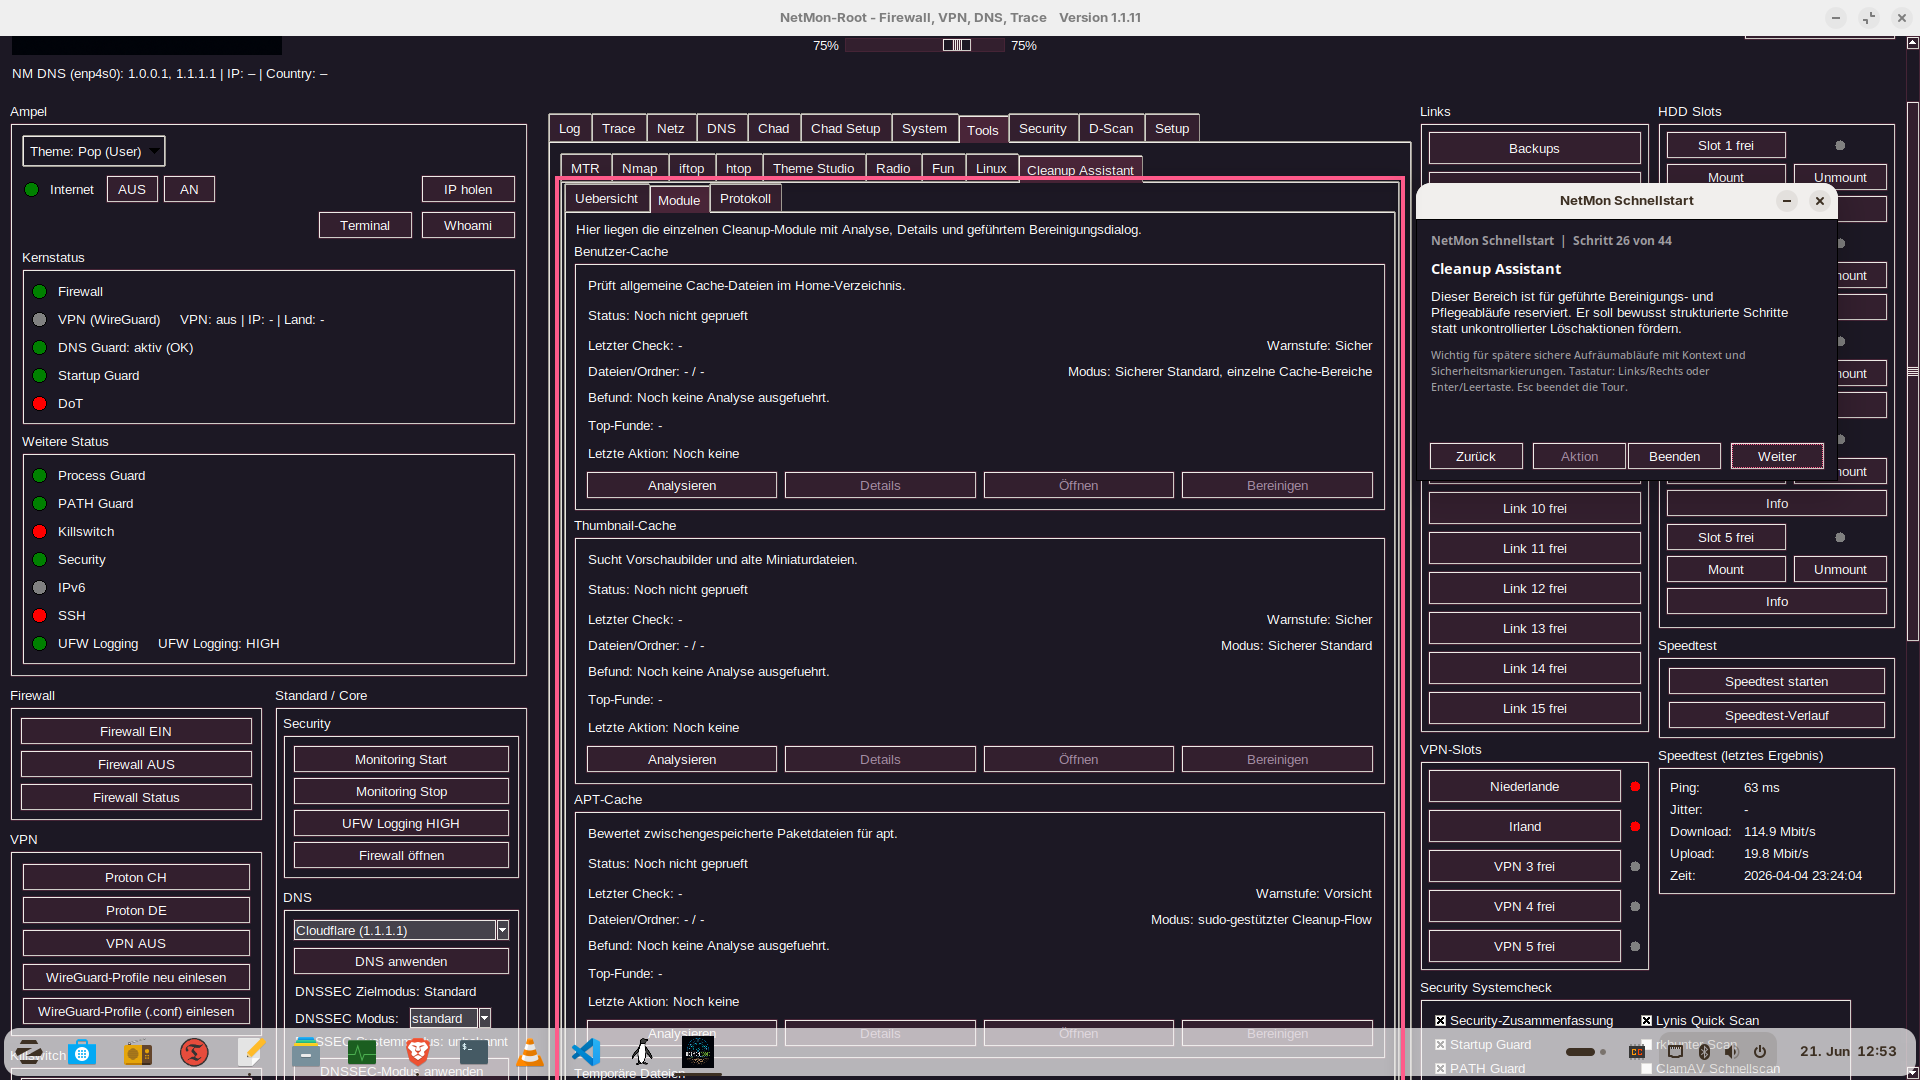
This screenshot shows the guided cleanup area with cache modules, analysis status, and structured actions for later maintenance runs.
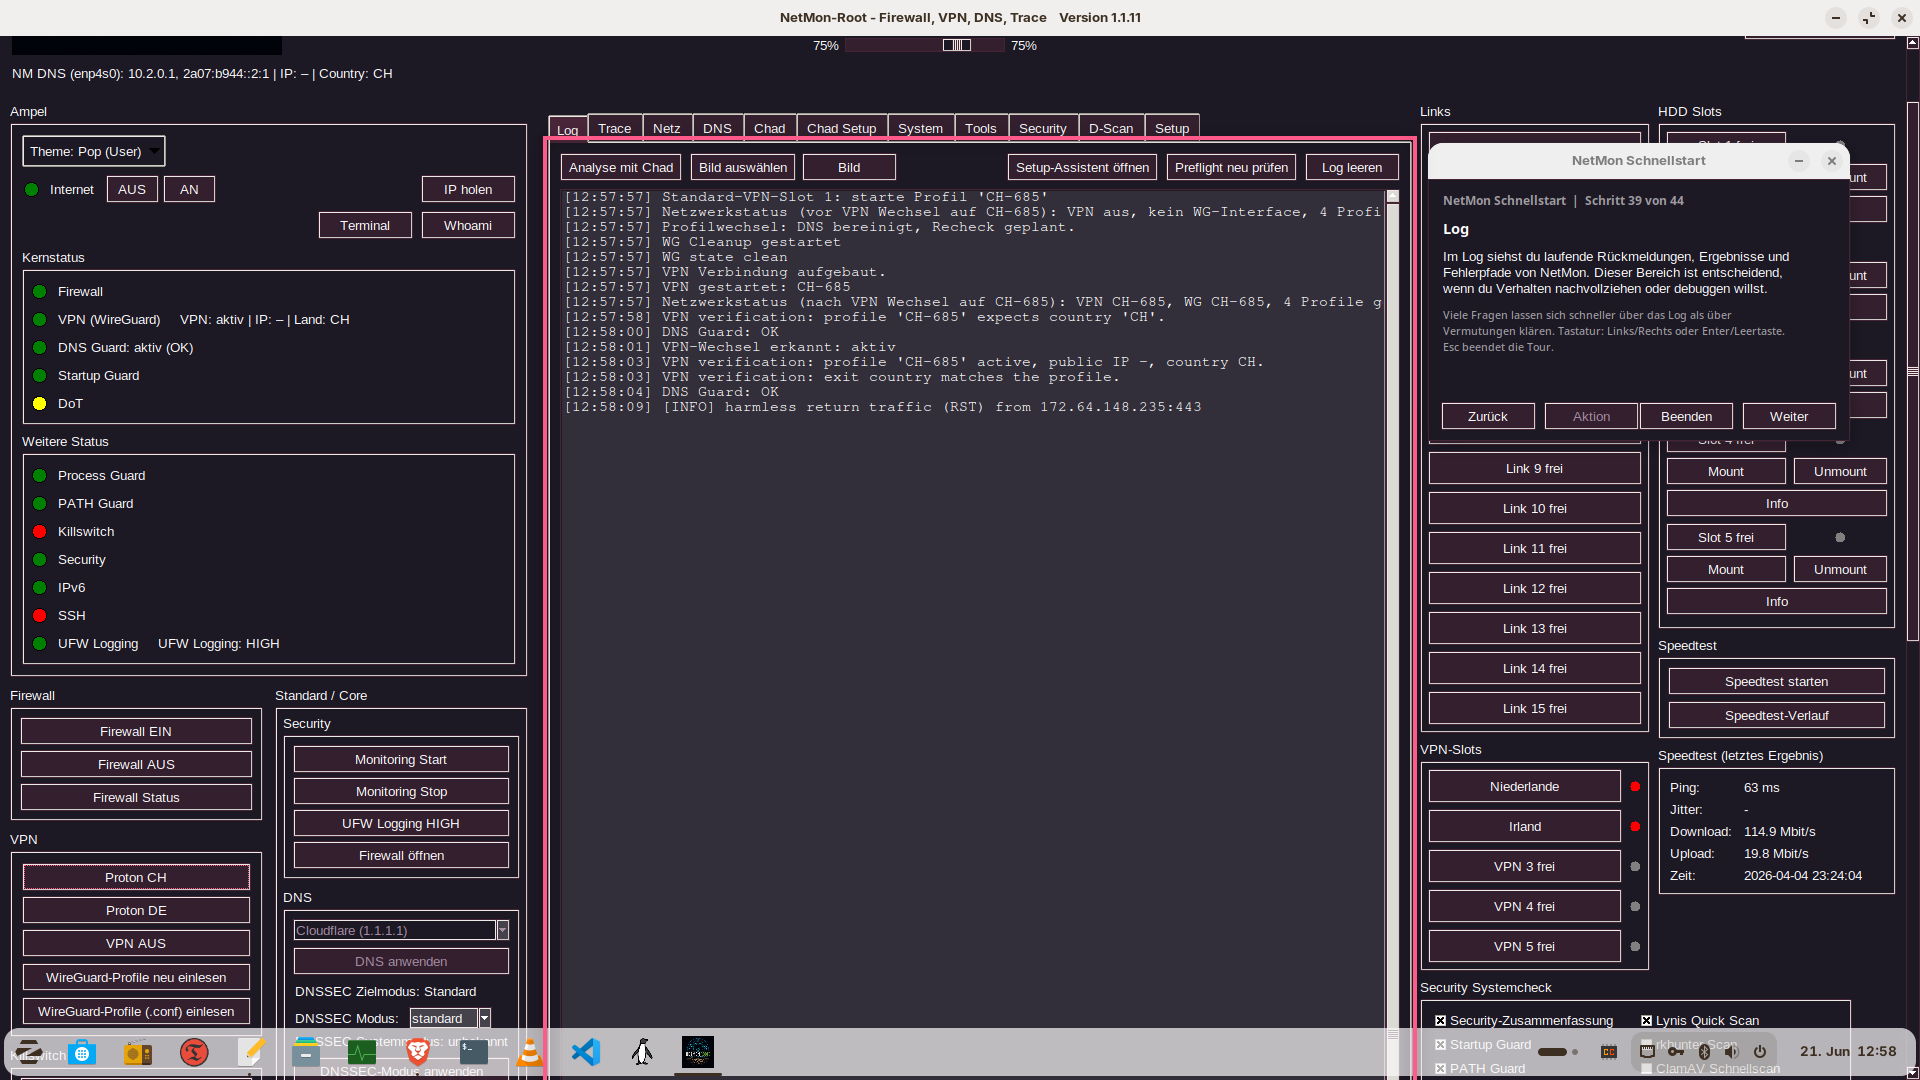
Technical output, status checks, and explainable diagnostics stay visible in the same product window.
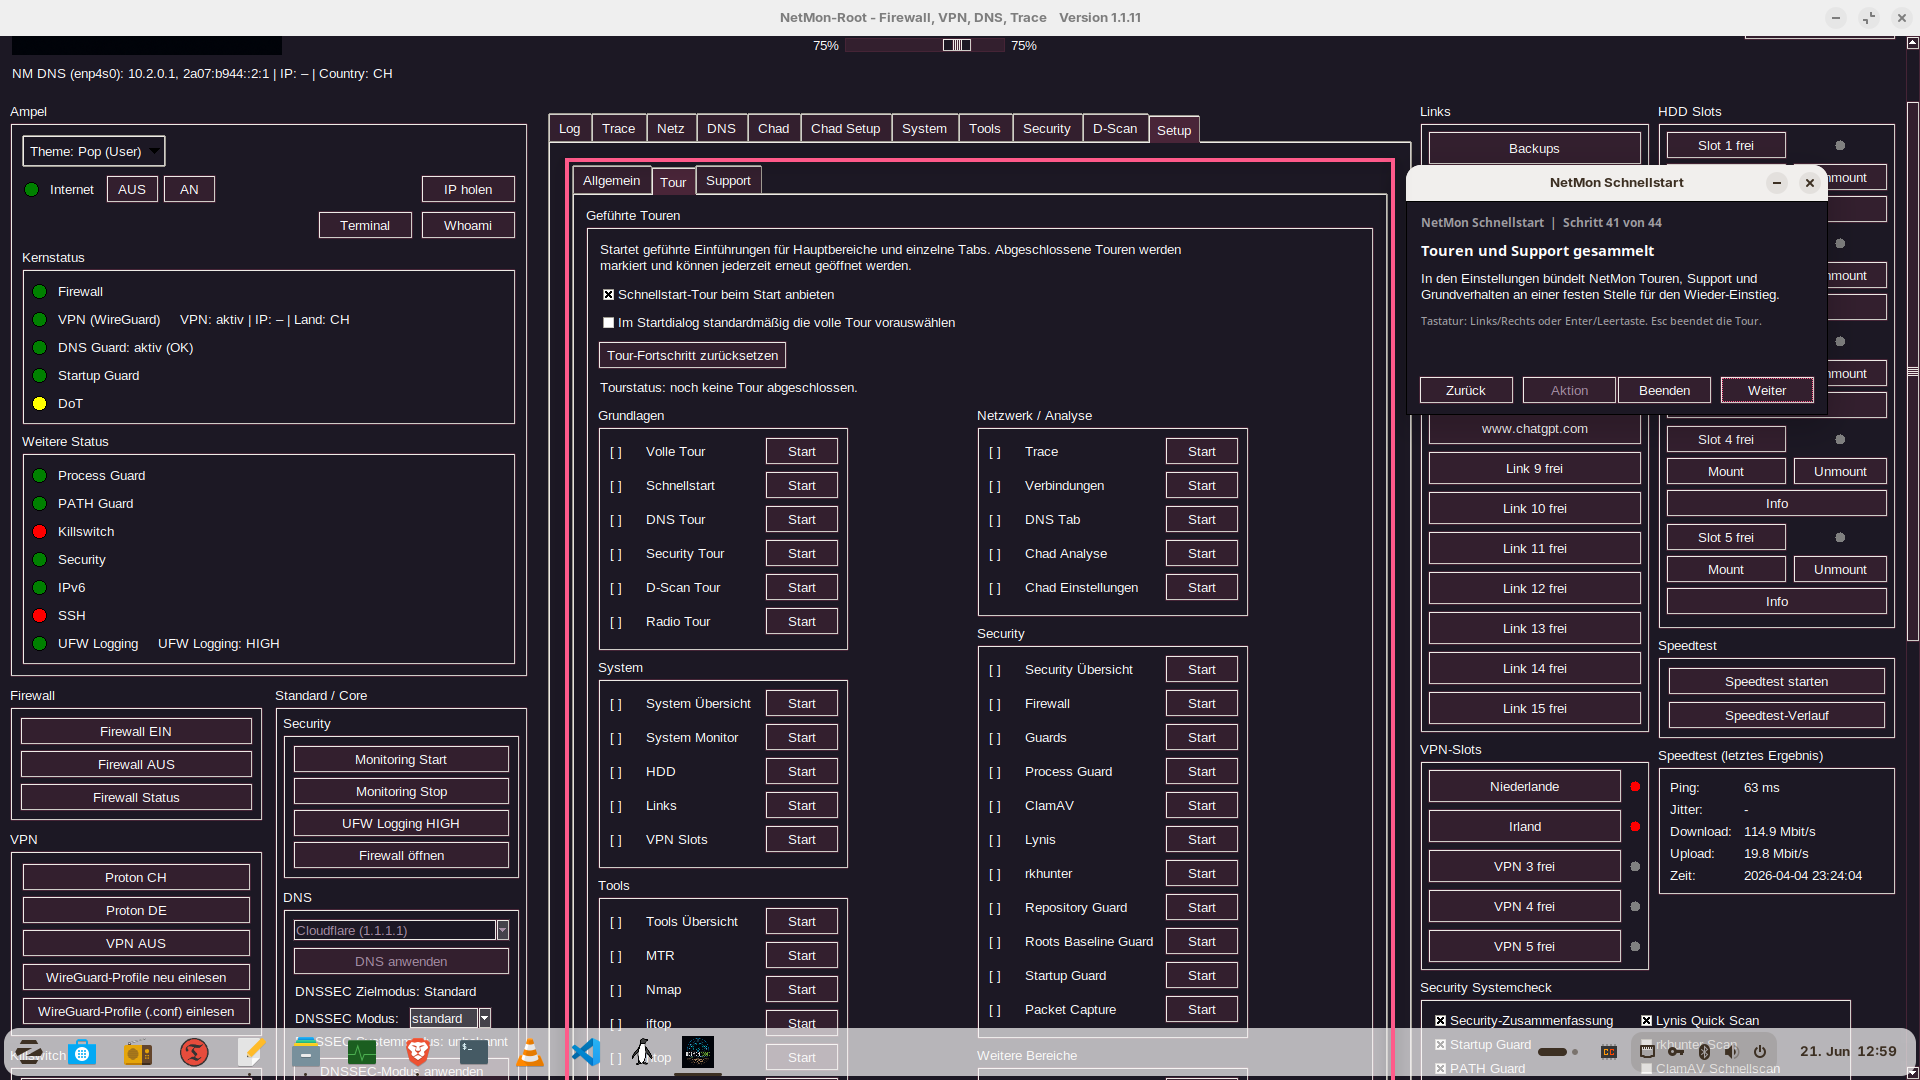
This view bundles guided tours, tour progress, and the support re-entry point inside one dedicated setup area.
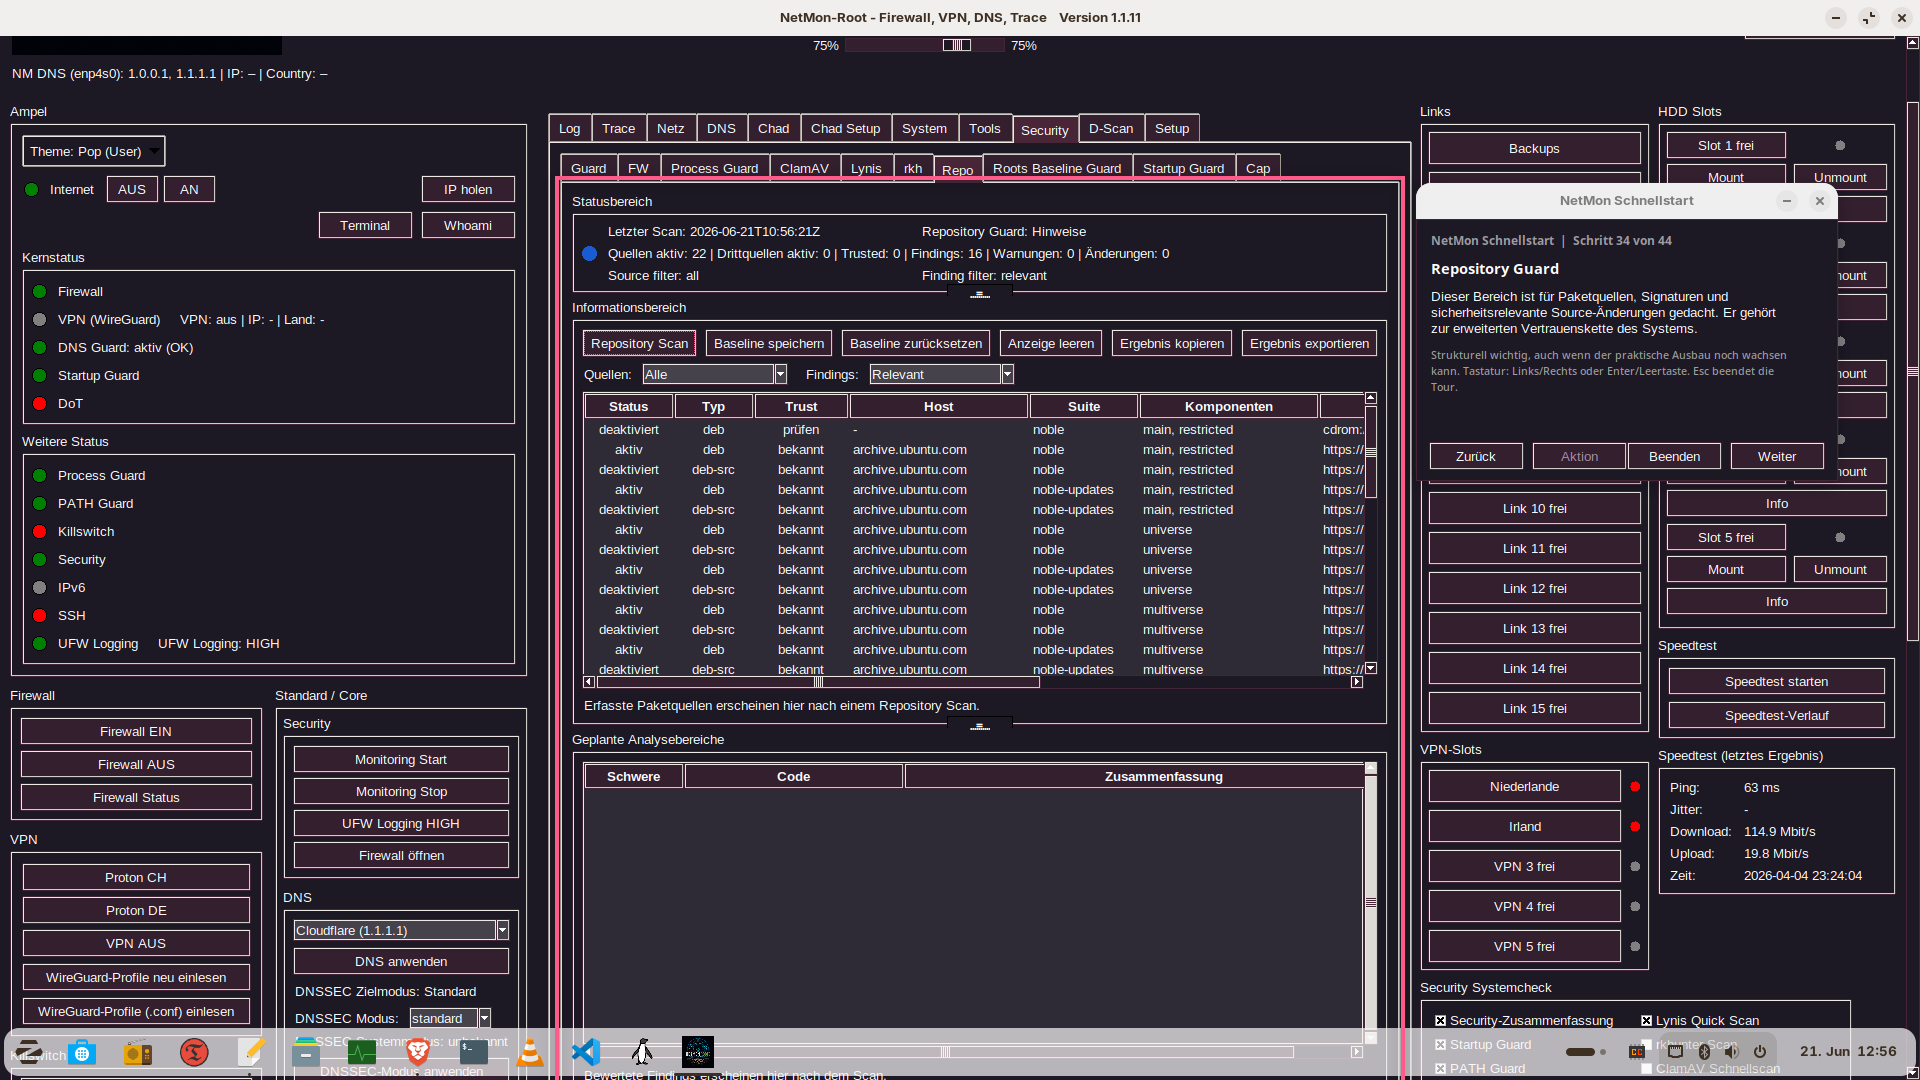
The view shows package sources, trust state, filters, and export paths for security-relevant source and repository checks.
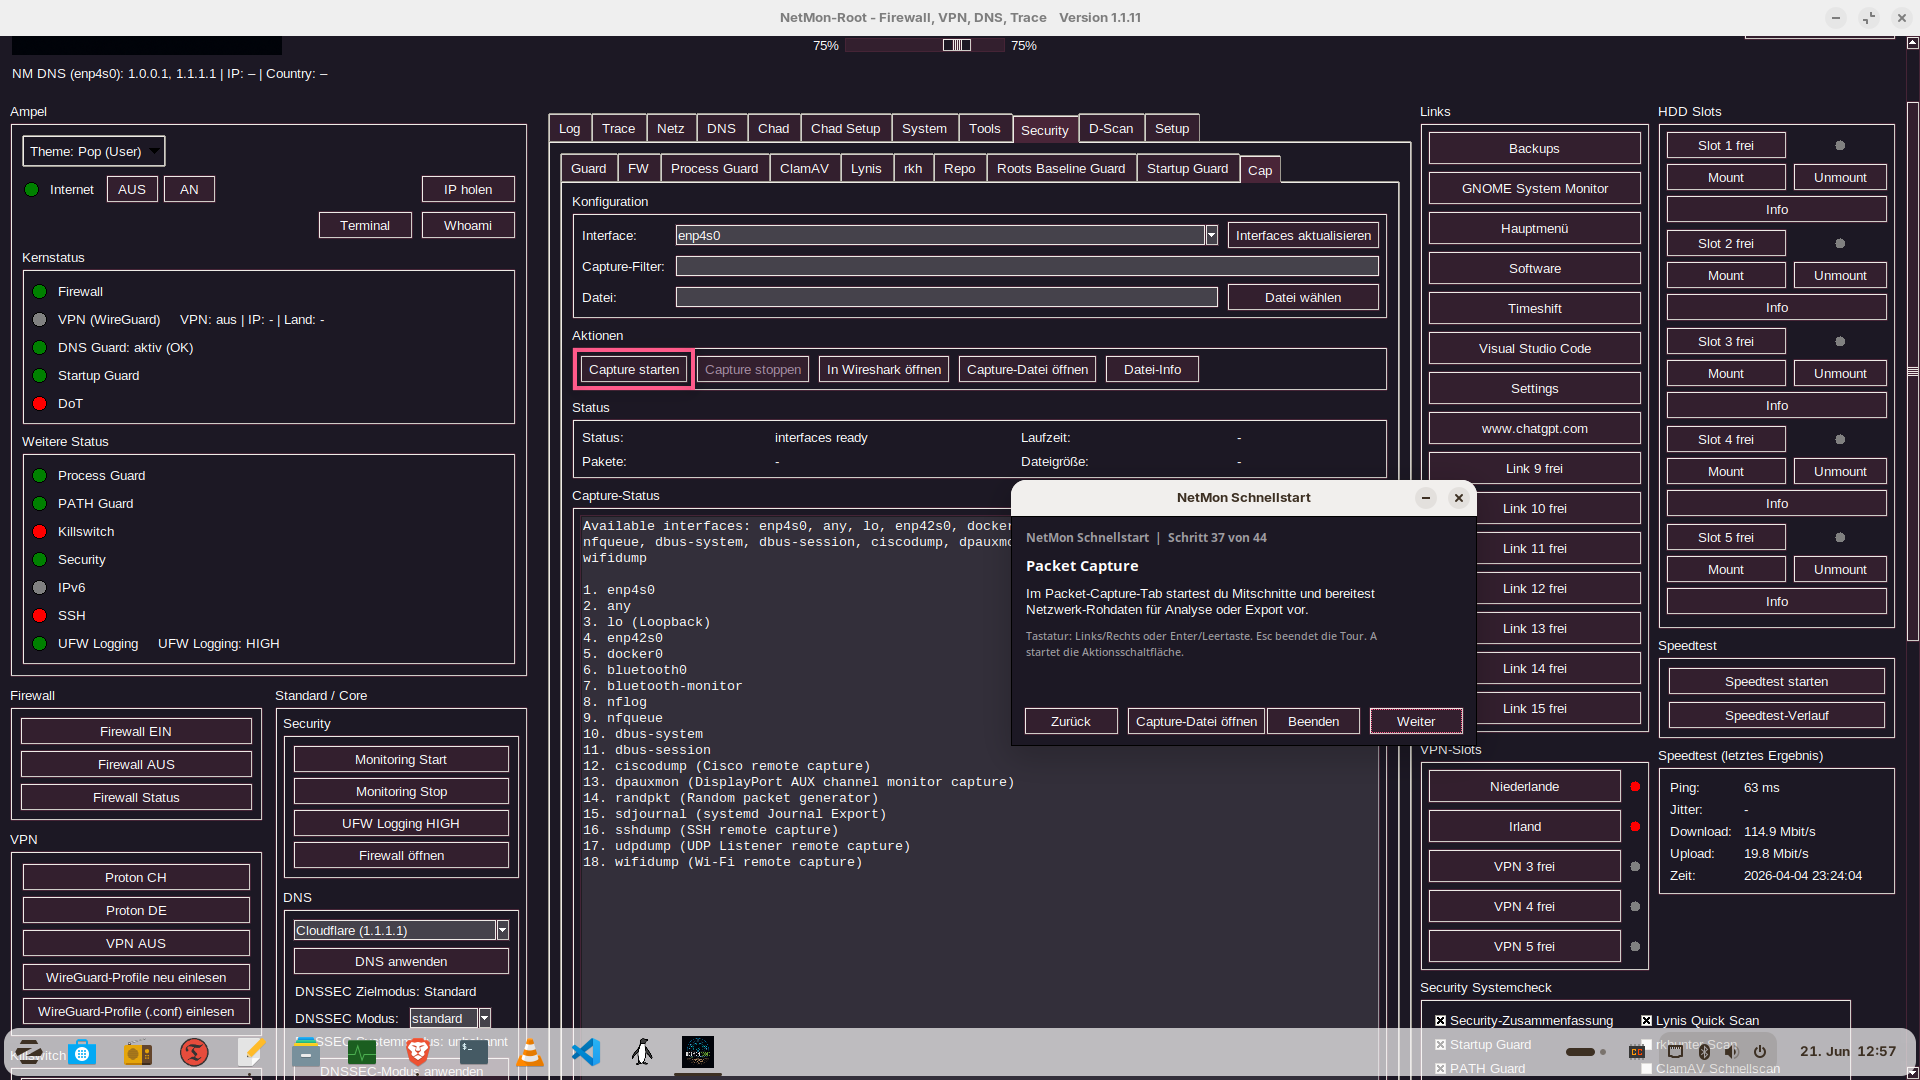
This screenshot shows the capture workspace with interface selection, capture controls, raw output, and a direct handoff to Wireshark.